
First, I built the system by hand
Before automating anything, I designed 30+ research charts by hand. That work became the foundation for a consistent Welltory system for hierarchy, color, annotation, typography, and data display.


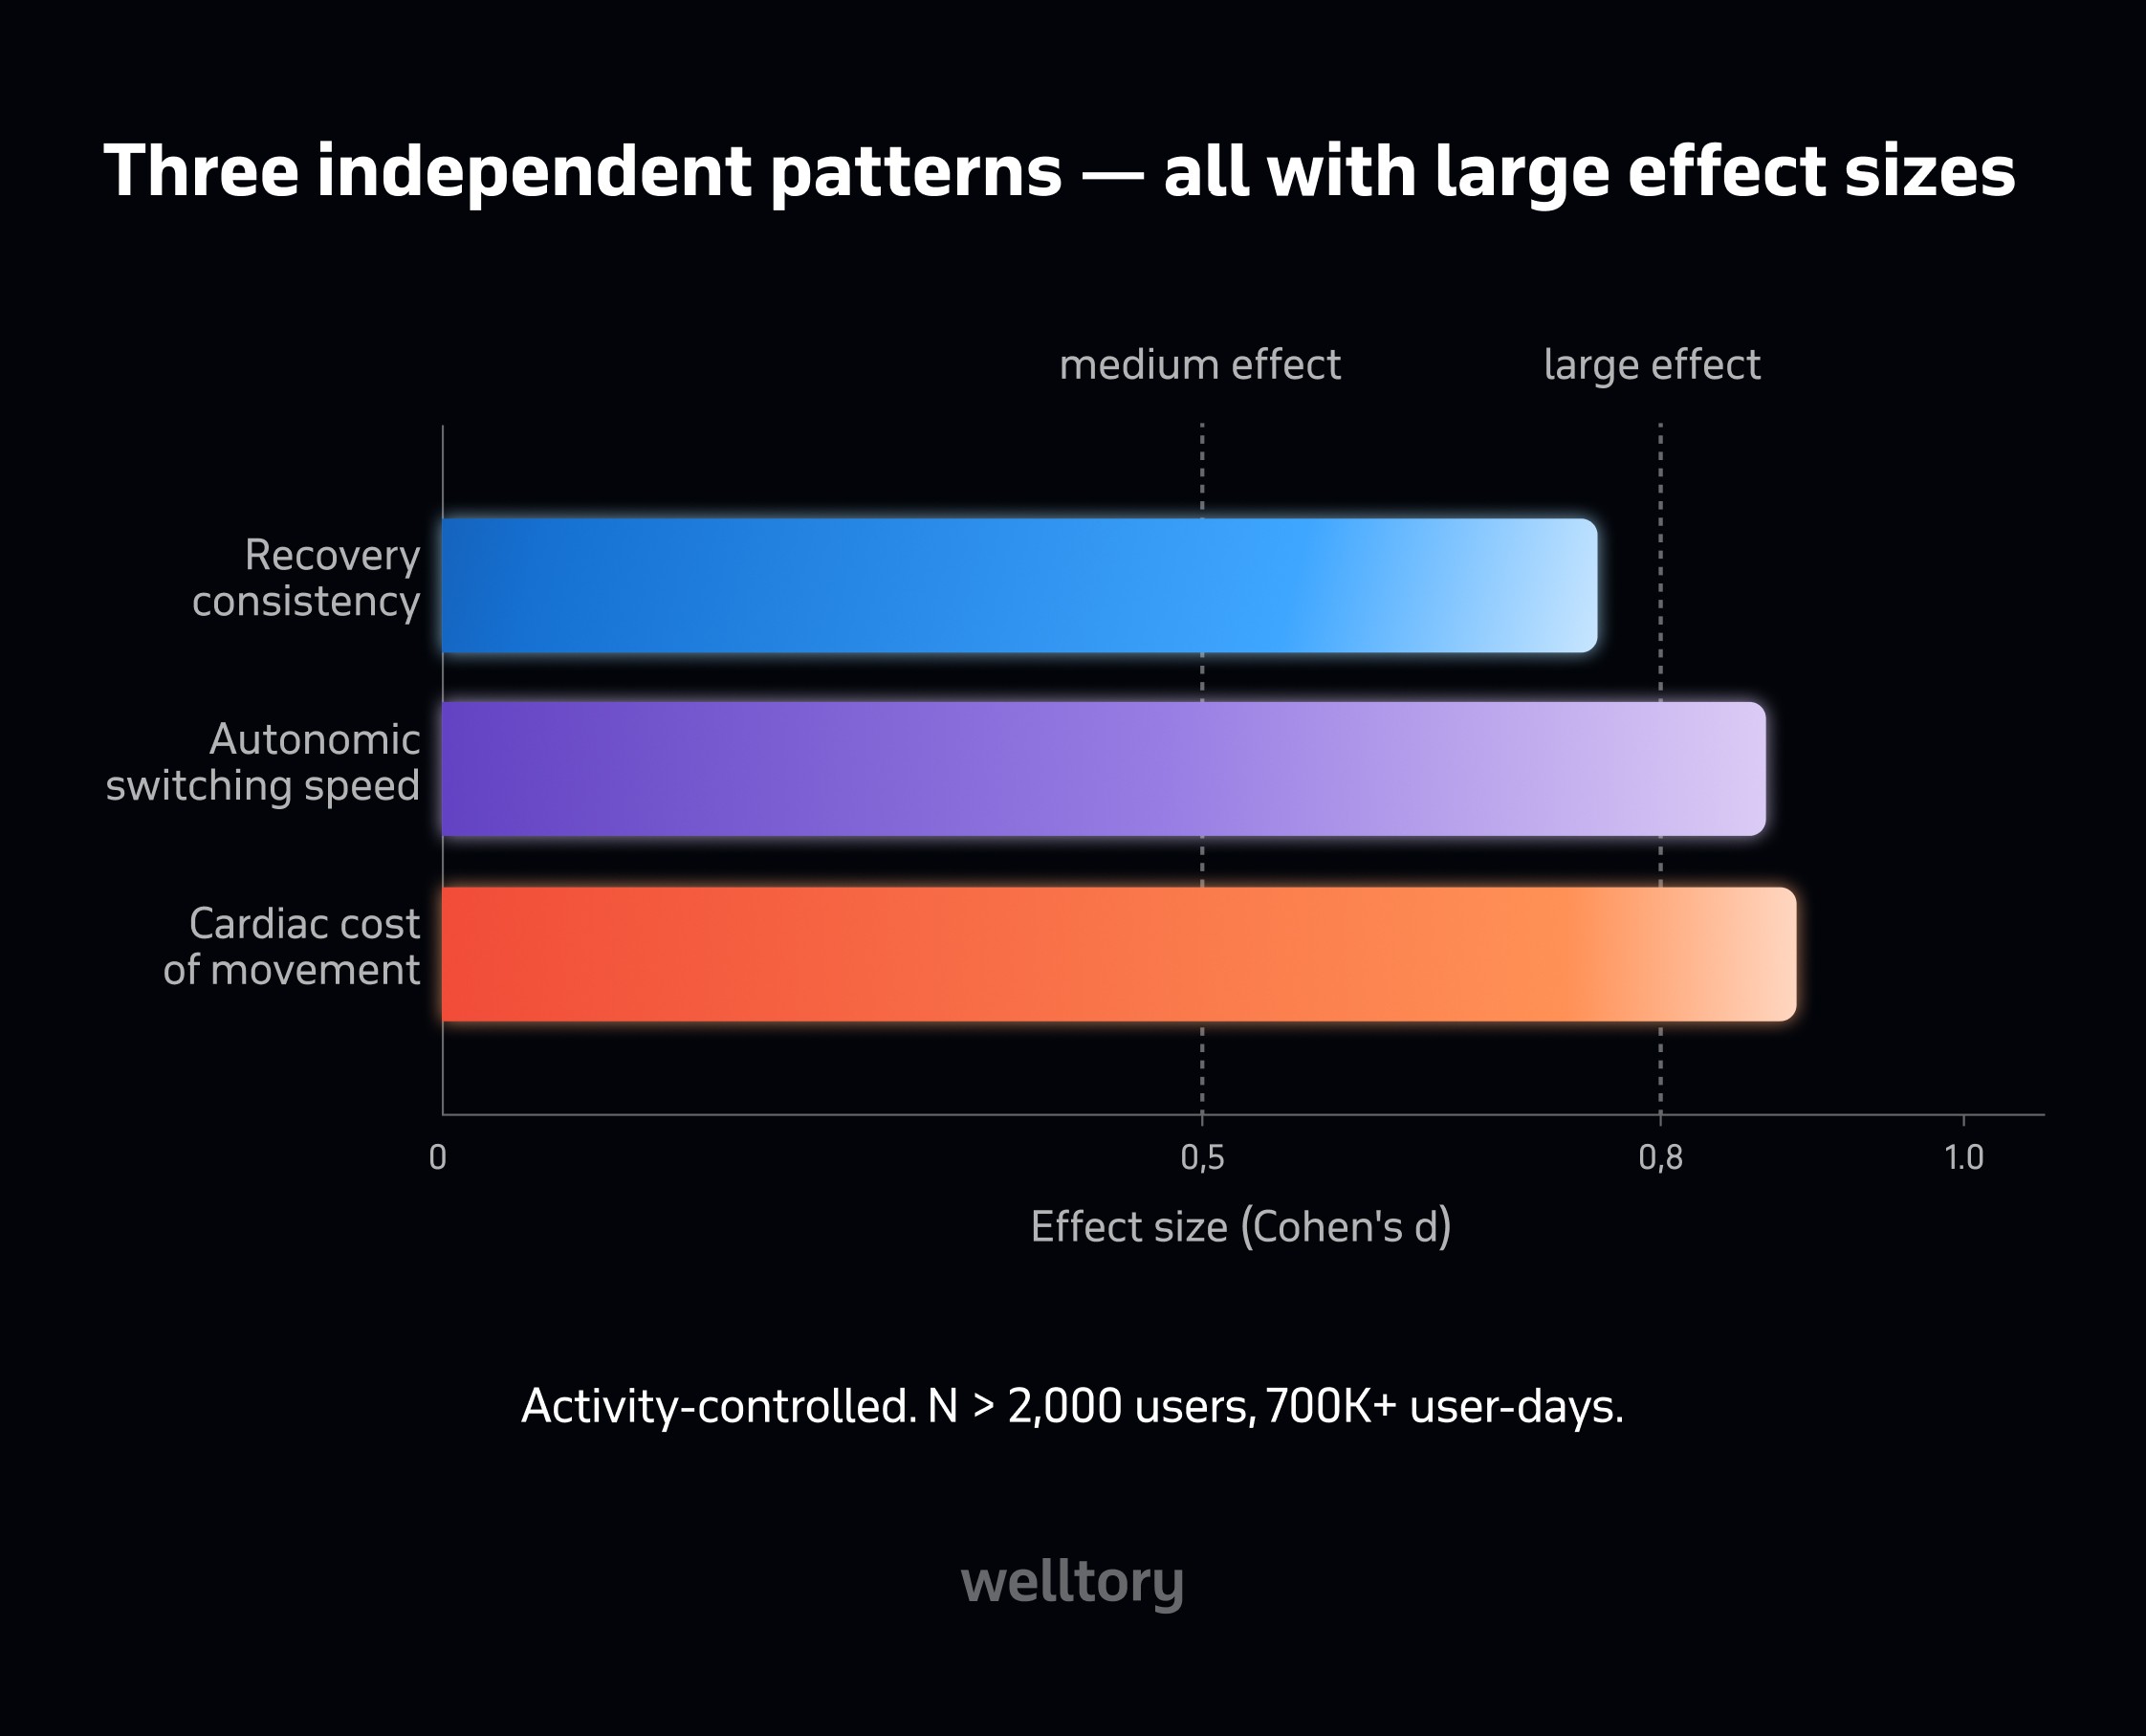


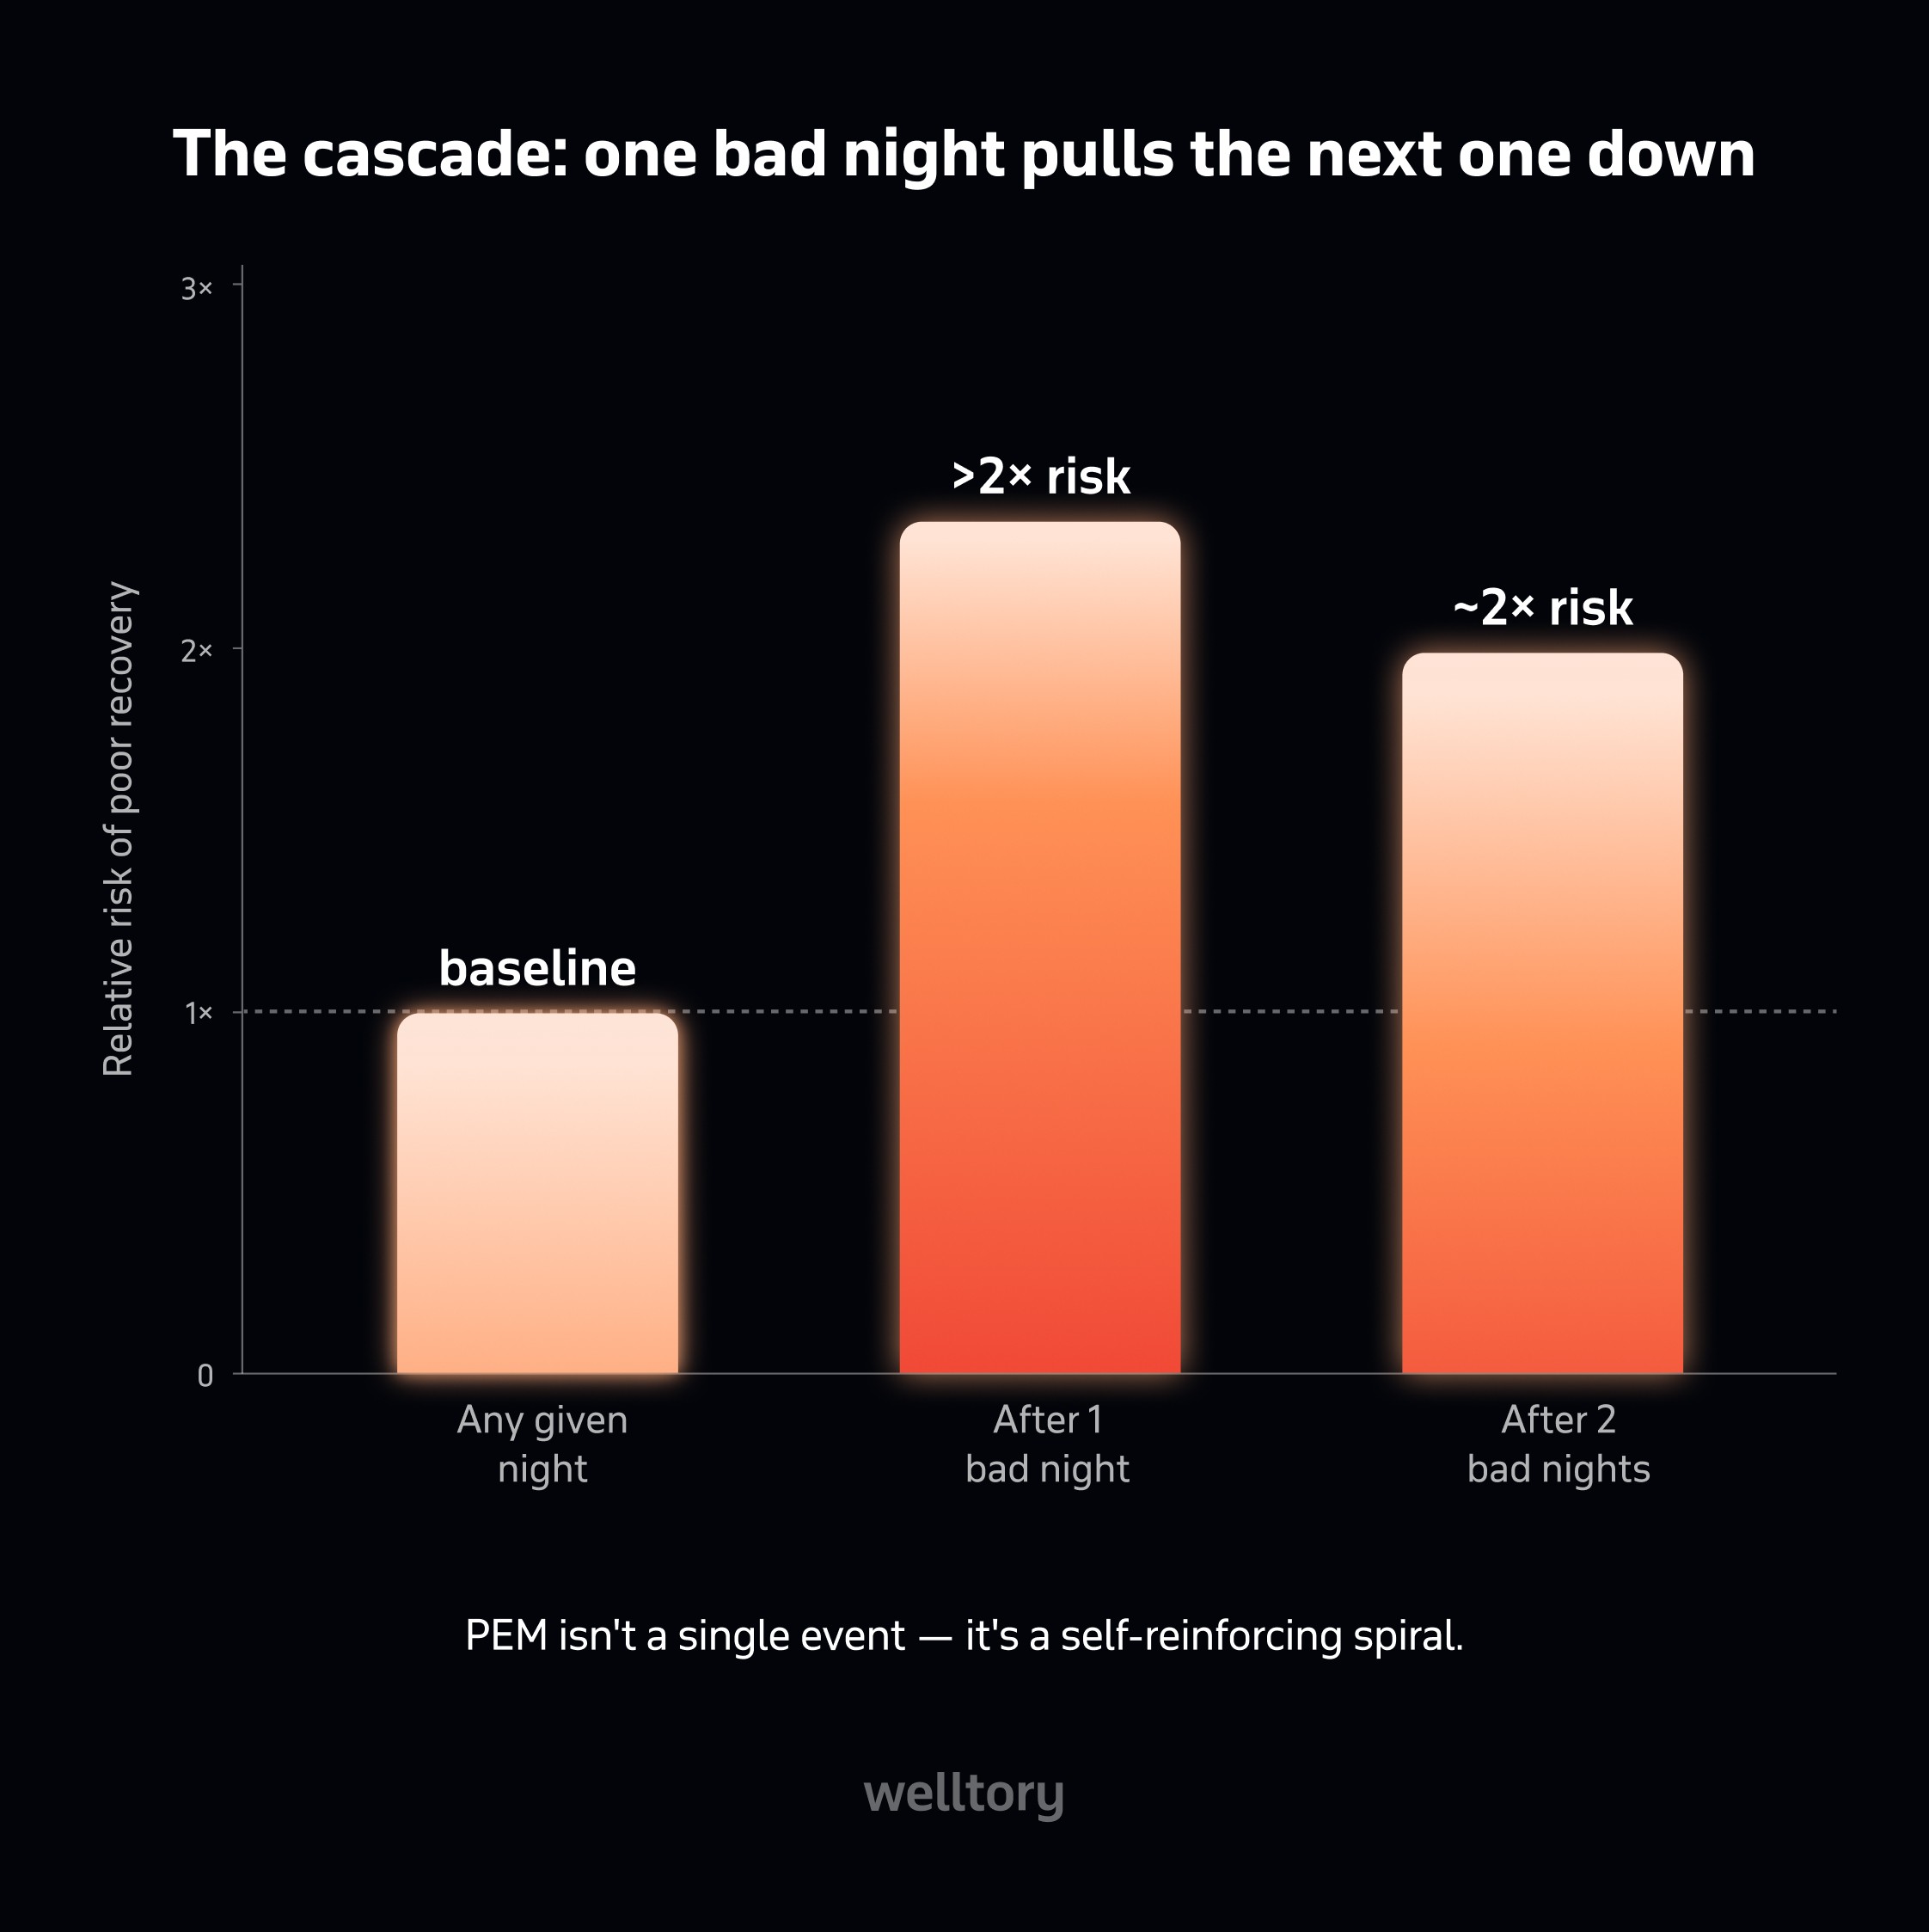

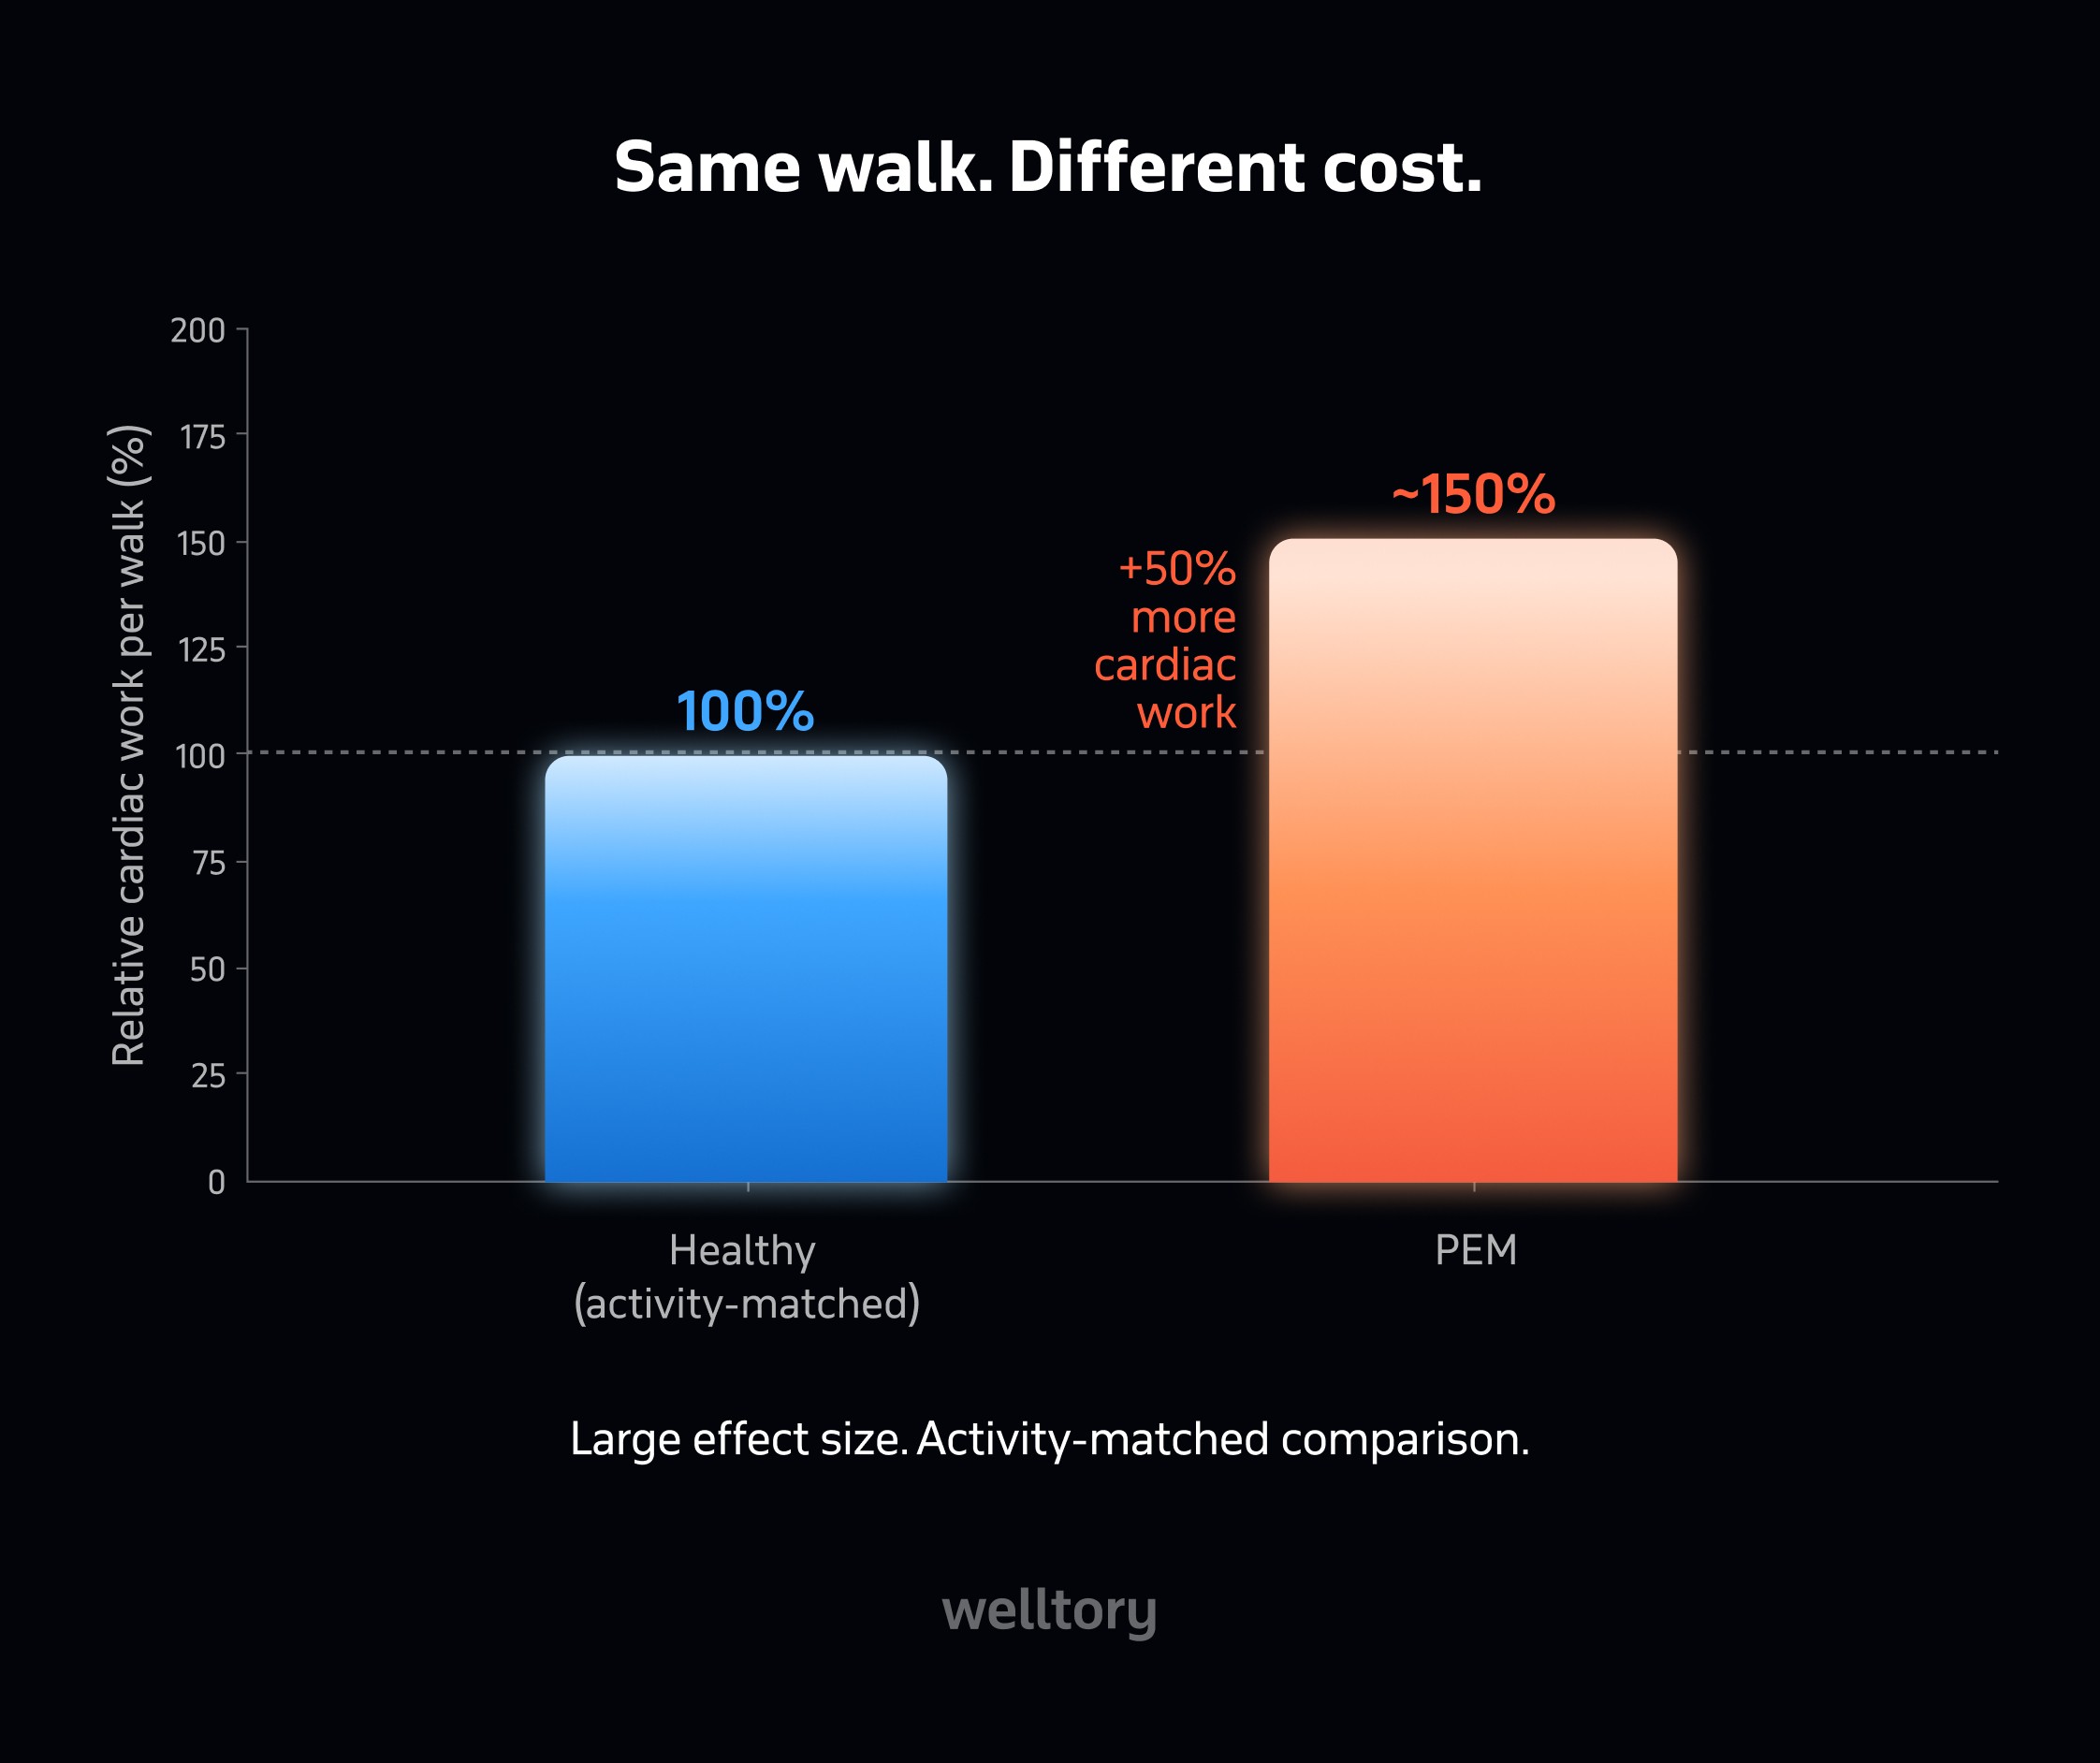


Making the system repeatable
I translated the decisions I was making manually into explicit rules the Skill could apply consistently.
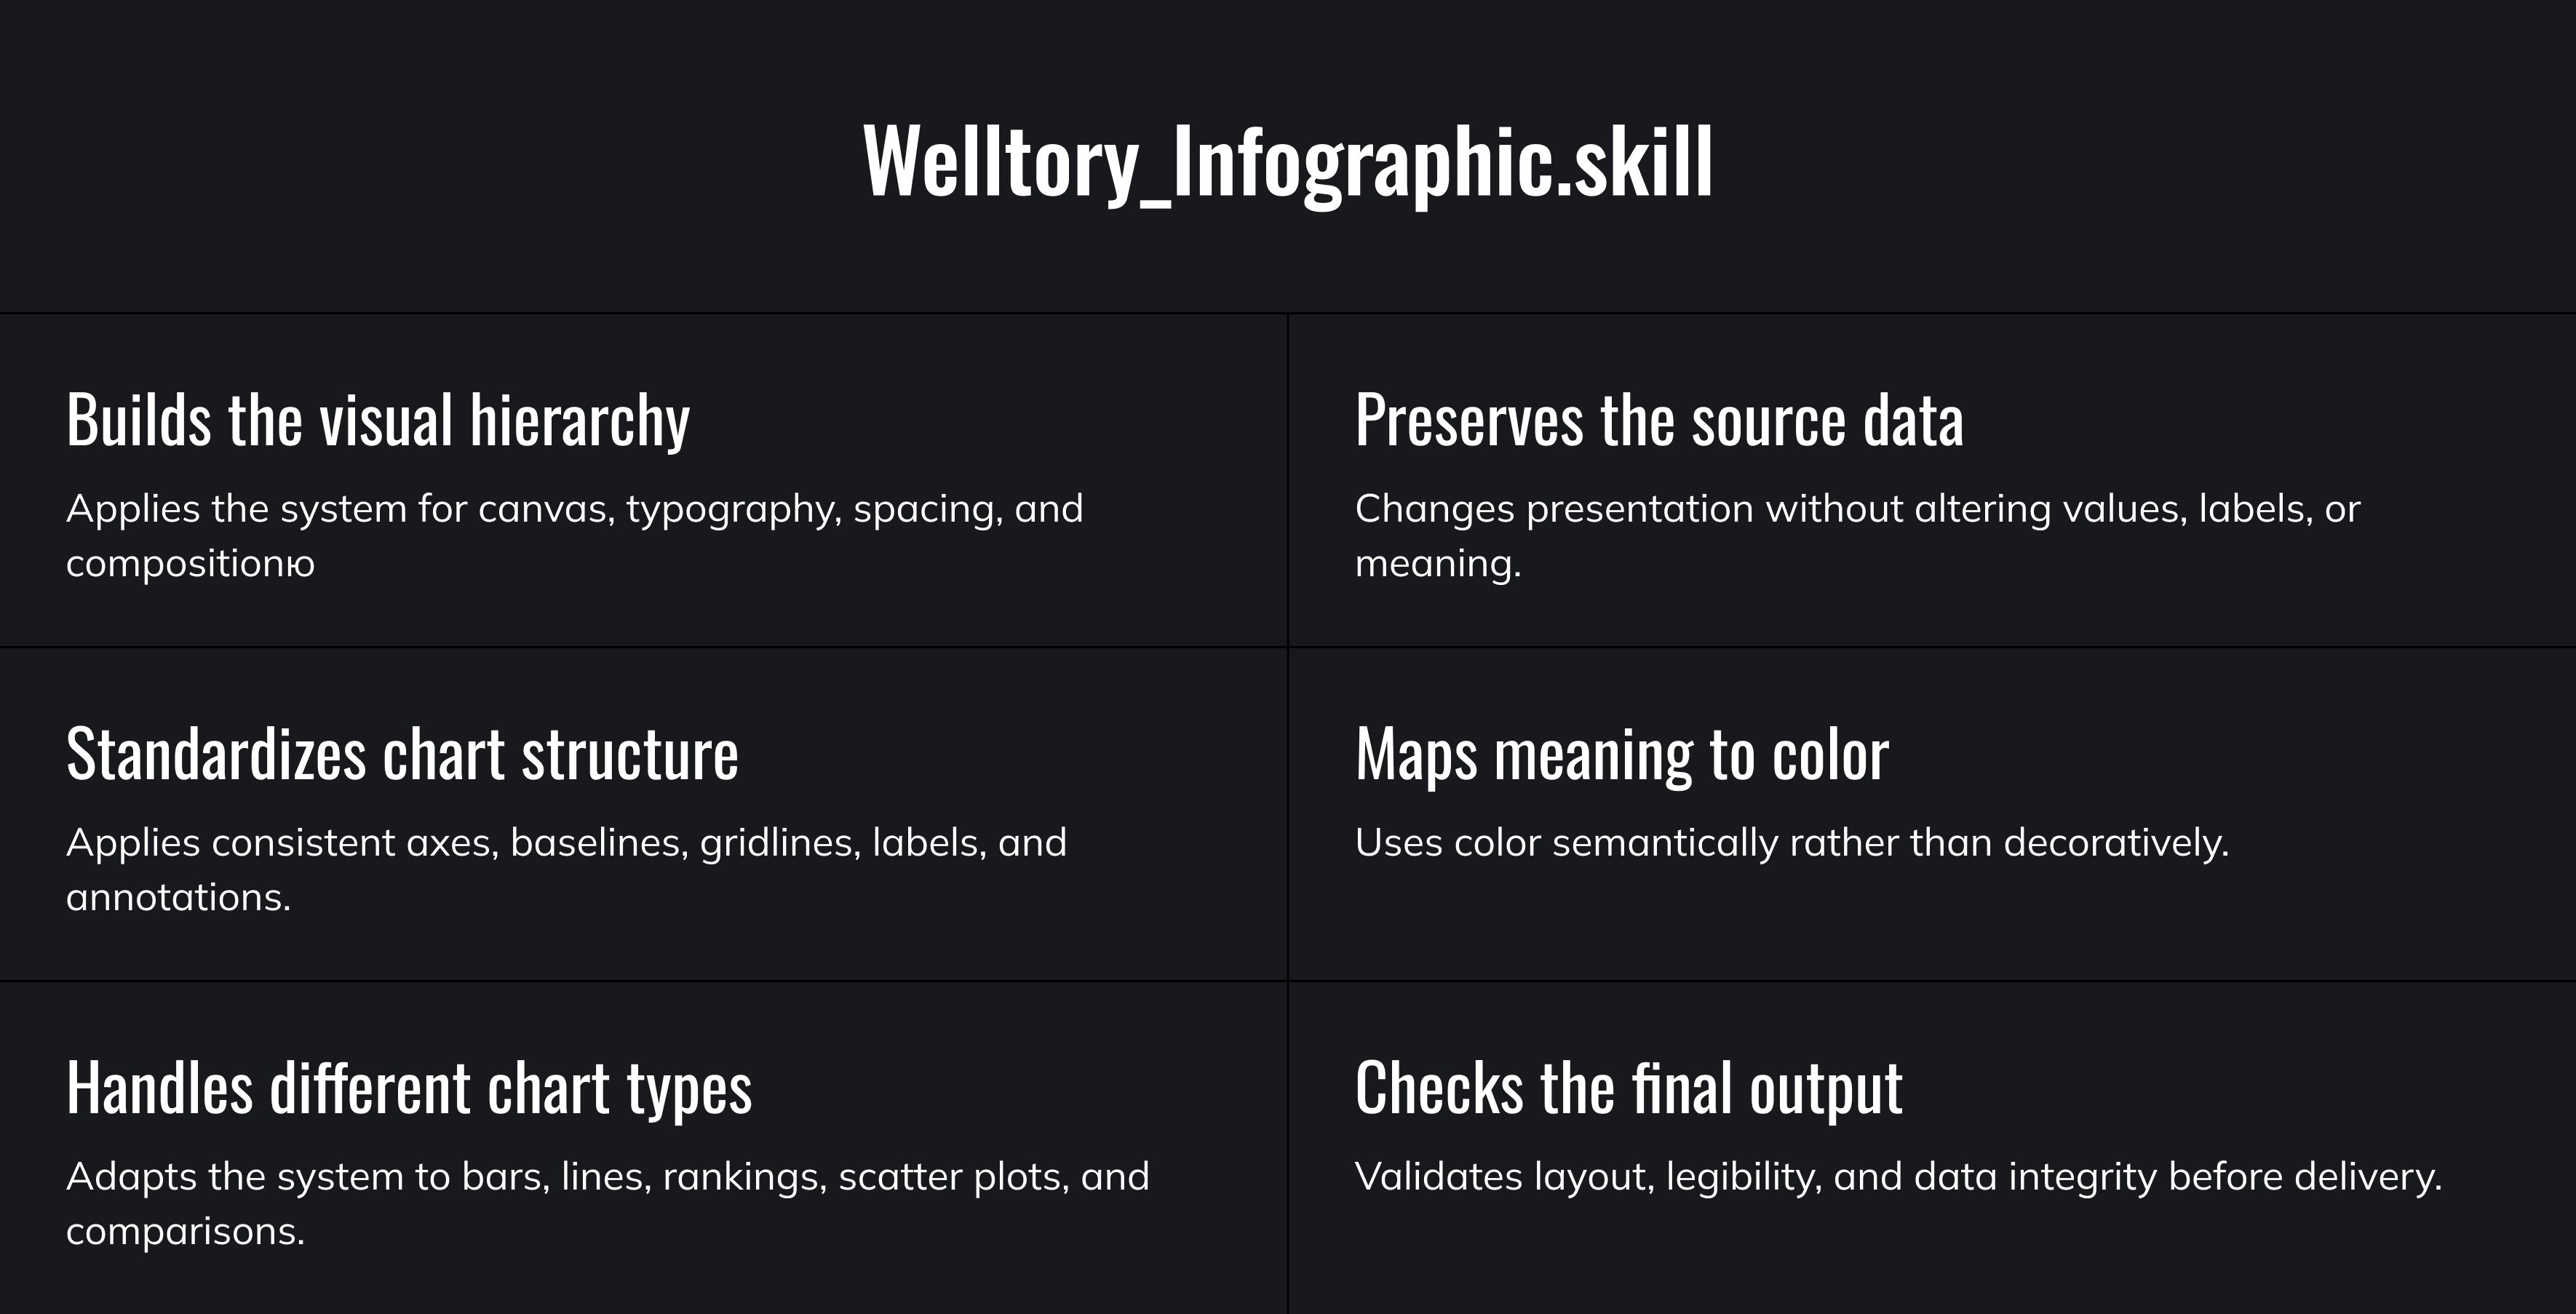

Creating an infographic now takes minutes instead of around an hour, and anyone on the team can do it using the Skill.
Same data. Different visual language.
The Skill can take an existing chart and rebuild its presentation in Welltory’s visual system without changing the underlying data or meaning.
Source chart


Result


Source chart
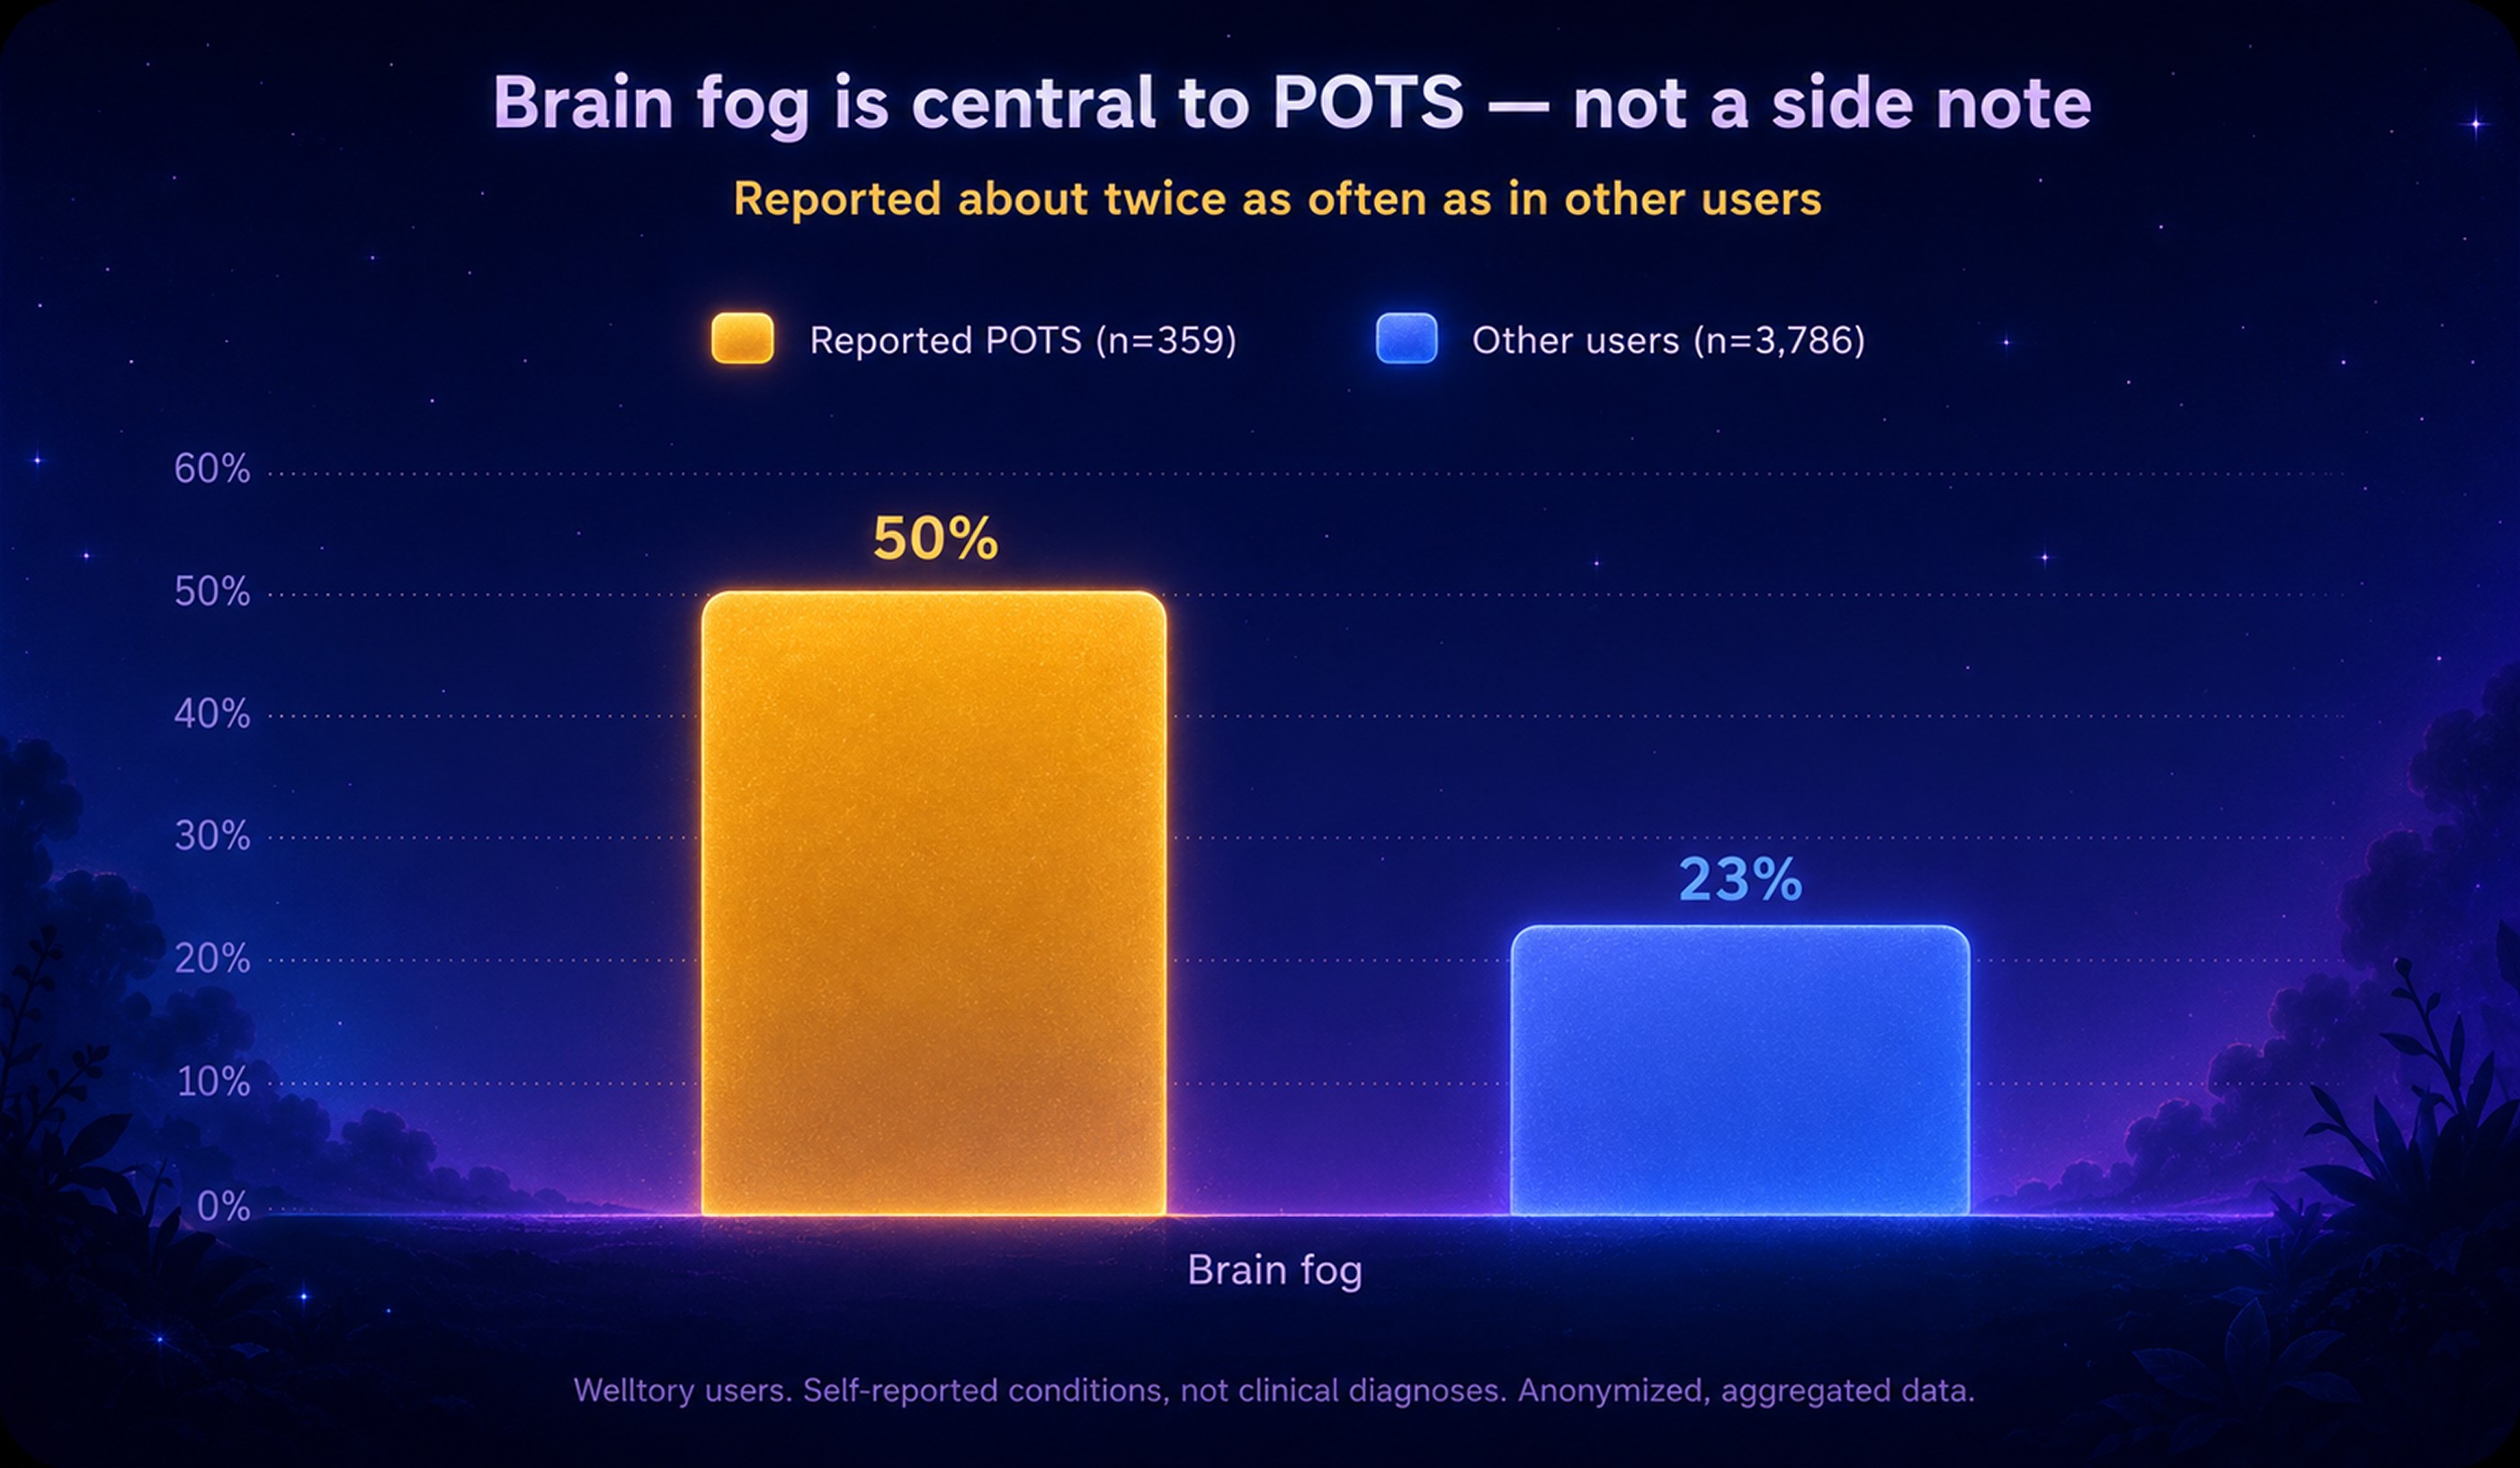

Result


Source chart


Result


Source chart


Result


Built for production, not a demo
The system now produces charts used in real Welltory articles — turning raw research visuals into publication-ready infographics in minutes.


